Mapping Seagrass: A Visual Approach to Conservation Research
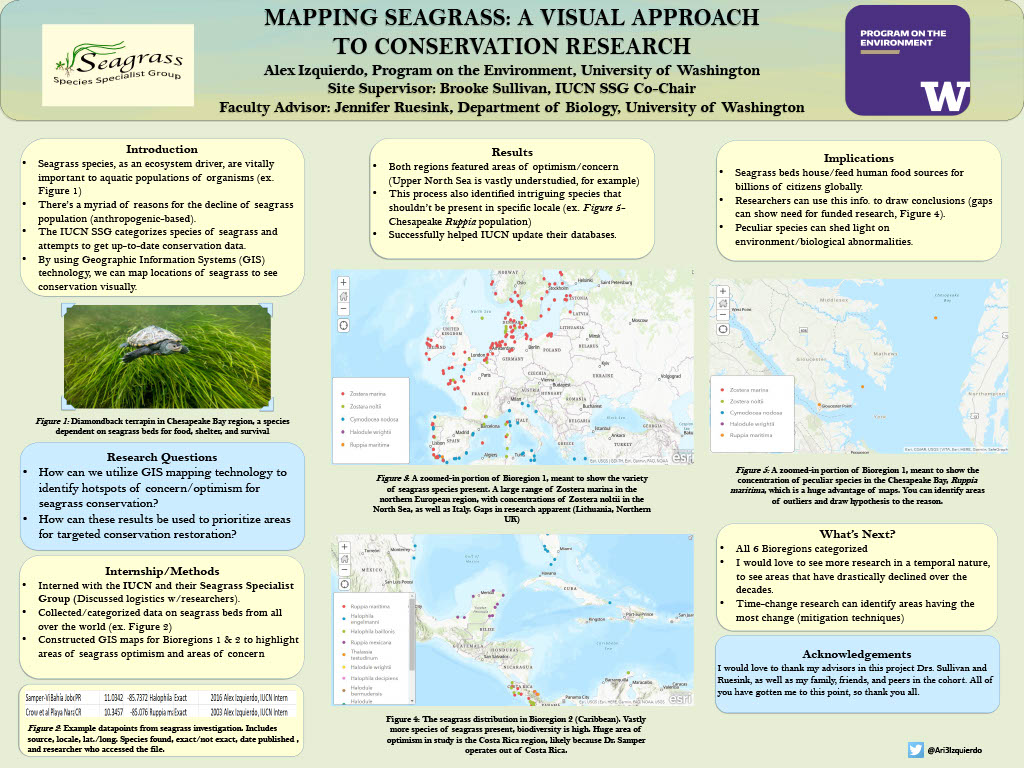
Seagrass species, as an ecosystem driver, are vitally important to aquatic organisms and are a staple in thousands of species’ lives, with functions such as sustenance, shelter, nursery, etc. However, seagrass numbers globally are declining with no end in sight, if humans do not step in and mitigate. Seagrass species have been steadily decreasing in numbers, with 51,000 km2 of seagrass meadows have been lost during the past 127 years. Humans depend on seagrass as well, with billions of people’s diets stemming from the organisms that feed/shelter in seagrass. The purpose of the study I conducted with the Seagrass Specialist Group was to use maps to identify hotspots of concern/optimism in seagrass conservation. Additionally, I wanted to be able to use those maps to draw inferences and make hypotheses about why certain areas had abundant seagrass plots and why some had little. To accomplish this task, I combed through scholastic databases to look for records of seagrass beds in Bioregions 1 and 2 (North Atlantic and Caribbean respectfully). I then compiled each datapoint into a database and configured it to appear on the GIS map, complete with a legend with information about each record of seagrass. My findings show that areas with many researchers and/or high GDP per capita likely have the most seagrass studies conducted, mainly because they have the facilities to conduct on-site research. Funding for more remote locations poised to have seagrass beds should be a priority so we get a more holistic view of seagrass research.